From Plans to Reality: Sub-Saharan Africa’s Budget Credibility
Pablo Lopez Murphy, Can Sever and Qianqian Zhang | 30 June 2026
Fiscal, Blog | Tags: Africa, Tax Expenditures
The views expressed here are those of the author(s) and do not necessarily represent the views of the IMF, its Executive Board, or IMF management.
Introduction
Budgets are the central policy instrument for articulating government priorities, allocating scarce resources, and determining the fiscal stance. They set out governments’ expectations for revenues, borrowing, and spending based on policy priorities, macroeconomic forecasts, and financing assumptions. Since budgets rely on forecasts and assumptions about the future, actual outcomes may not perfectly align with budget plans. Economic conditions can change unexpectedly, revenues may fall short of projections, spending pressures can emerge during the year, or governments may need to redirect resources toward more immediate priorities.
While some deviations are inevitable, large and persistent gaps between budget plans and actual outcomes undermine the effectiveness of this process, and hence, the credibility of budgets. Non-credible budgets, in turn, weaken macroeconomic management, erode investor confidence and public trust, and impair governments’ ability to deliver development priorities.
How Large are Deviations from Budgets in Sub-Saharan Africa?
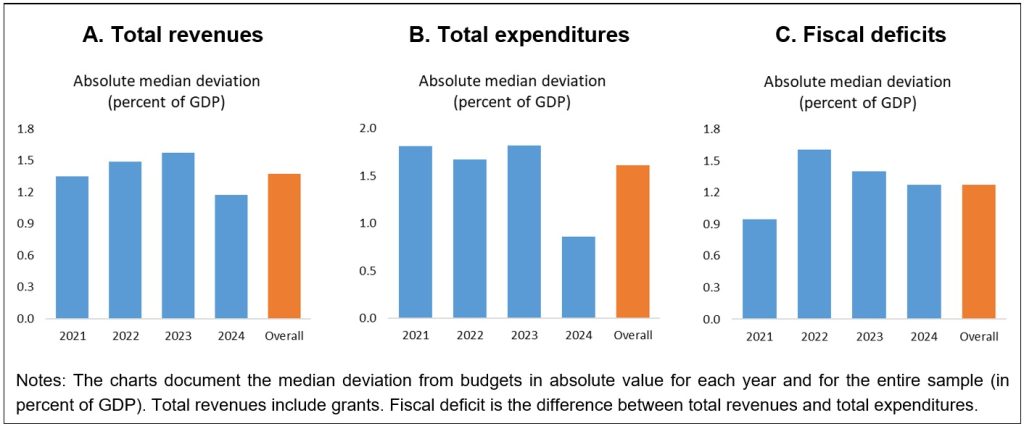
A new IMF Paper examines these challenges in sub‑Saharan Africa (SSA), using data from 39 SSA countries over 2021–2024 to track deviations between approved budgets and realized fiscal outcomes. The findings suggest that sizeable gaps between budget plans and actual outcomes were common across the region (Figure 1). In many cases, governments collected revenues that were significantly different than expected, spent more than initially budgeted, or recorded fiscal deficits that diverged substantially from original projections:
- For revenues, the median gap between budget projections and actual outcomes was about 1.4 percent of GDP over the period (Chart A).
- For expenditures, the median gap between budget plans and actual spending was about 1.6 percent of GDP (Chart B).
- Lastly, for fiscal deficits, the median gap between projected and actual outcomes was about 1.3 percent of GDP over the same four years, rising from 0.9 percent of GDP in 2021 to 1.3–1.6 percent in subsequent years (Chart C).
Figure 1: Deviations in Revenues, Expenditures, and Fiscal Deficits
The composition of these deviations also reveals several important patterns:
Fiscal deficits were frequently higher than budget projections, reflecting both optimistic revenue forecasts and persistent spending overruns.
Current spending —particularly spending on public wages, goods and services, and transfers— persistently exceeded budget targets, while interest payments also added fiscal pressure.
At the same time, capital spending was often lower than originally budgeted. Governments frequently reduced investment spending as fiscal pressures intensified, often using it as an adjustment margin to contain widening fiscal deficits, despite the region’s large infrastructure and development needs.
Revenue projections also tended to be optimistic, especially for grants and, in some cases, tax revenues, creating financing gaps that only became apparent during execution.
How do Budget Deviations interact: What Drives What?
The patterns in the data also help explain when fiscal deficit overruns most likely occur, which expenditure and revenue deviations matter most, and when governments are most likely to scale back capital spending.
First, fiscal deficit overruns were driven jointly by revenue shortfalls and expenditure overruns. Deviations in tax revenues and primary current expenditures played a central role. On average, when tax revenues exceed the budget by a meaningful margin, the fiscal deficit becomes about 1.0 percent of GDP smaller than planned; when primary current expenditures overshoot the budget by a similar margin, the deficit widens by about 1.2 percent of GDP compared to the budget.
Second, capital spending adjustments were closely tied to revenue underperformance. A notable shortfall in grants relative to the budget is associated with a 1.0 percent of GDP lower capital spending than initially planned, while a comparable underperformance in tax revenues predicts a 0.7 percent of GDP cut in capital spending.
Third, excess primary current spending was linked to revenue windfalls. Higher-than budgeted non-tax, non-grant revenues predict excess primary current spending. On average, when those revenues exceed the budget by a meaningful margin, primary current expenditures overshoot the budget by about 0.9 percent of GDP, pointing to weak commitment controls and procyclical spending.
What Helps Reduce Budget Deviations?
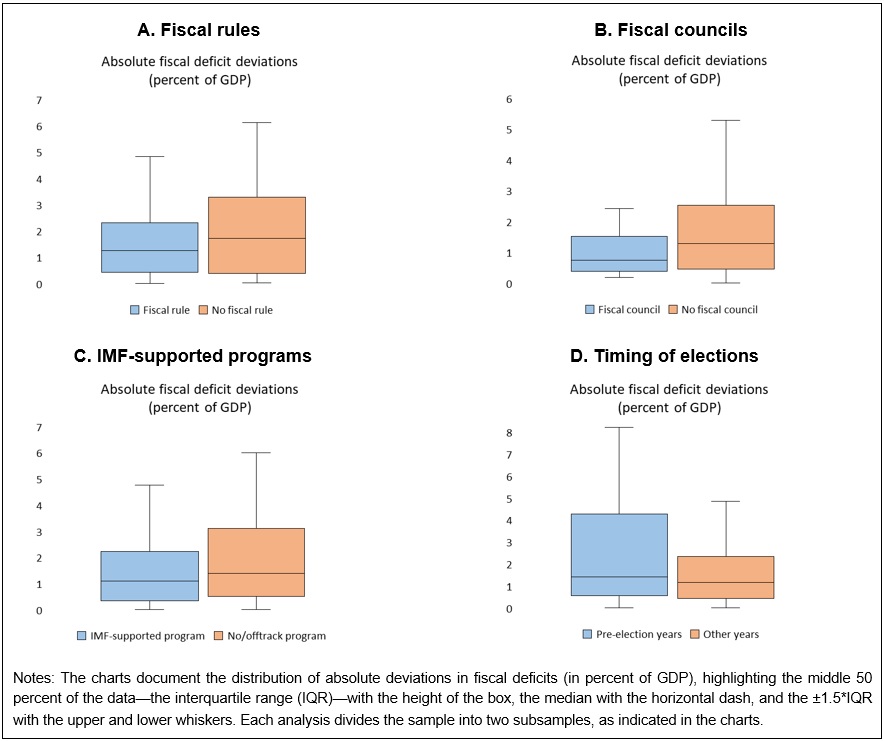
Institutional quality and policy anchors matter. Stronger fiscal institutions and IMF-supported programs were associated with smaller deviations from budgets, while political pressures amplified gaps between budget plans and outcomes in fiscal deficits (Figure 2).
Fiscal rules and independent fiscal councils improved budget credibility. Countries with fiscal rules recorded a 0.4 percentage points of GDP lower median deviation than those without (Chart A). Similarly, independent fiscal councils were associated with 0.5 percentage points smaller deviation in fiscal deficits, alongside a narrower dispersion in those deviations (Chart B).
IMF-supported programs reduced fiscal uncertainty (Chart C). Countries with IMF programs experienced a 0.4 percentage points of GDP smaller median deviation in fiscal deficits than those without, again with a tighter range of deviations. This suggests that conditionality and quantitative criteria in those programs act as a commitment device that supports adherence to budget targets.
Political cycles weakened fiscal discipline (Chart D). Median deviation in fiscal deficits was 0.2 percentage points of GDP higher in pre-election years compared to other years—with a substantially greater dispersion—indicating heightened fiscal uncertainty before elections.
Figure 2: Deviations in Fiscal Deficits: Institutional and Political Factors
A Reform Roadmap to Better Align Budgets with Outcomes
Taken together, the findings suggest that budget deviations in SSA are neither random nor temporary. Instead, they reflect persistent structural weaknesses that require sustained institutional reforms. The results point to several policy priorities across SSA:
- Improve revenue forecasting. Governments need more realistic revenue forecasts grounded in solid macro-fiscal frameworks, recent outturns, and transparent assumptions. Strengthening macro‑fiscal units, institutionalizing forecast evaluation, and applying prudent assumptions—especially for grants—are critical.
- Reinforce top-down budgeting. Aggregate spending should be tightly anchored to macroeconomic constraints set early in the budget process. Stronger top-down constraints compel prioritization and limit opportunistic reallocations.
- Strengthen spending controls. Robust commitment, verification, and payment controls are essential to prevent overspending and arrears, ideally centralized in the finance ministry and supported by well-defined exceptional procedures.
- Protect capital spending quality and execution. Mandatory project appraisal, protected maintenance budgets, realistic cash-flow forecasting, and early-warnings systems can shield investment from becoming a fallback adjustment tool.
- Anchor credibility with institutions and external commitments. Fiscal rules, independent councils, and comprehensive fiscal risk frameworks help discipline policymaking. When relevant, IMF-supported programs can reinforce these anchors.
- Mitigate political budget cycles. Stronger legislative scrutiny, enhanced reporting requirements, and clear caps on in‑year reallocations can curb discretion in election periods.
- Align development partner support with national systems. Parallel financing mechanisms, opaque off-budget projects, and earmarking can undermine transparency and weaken overall budget credibility.
Related Posts

Why Tax Expenditure Reporting Is a Missing Link in Financing for Development
Alexandra Readhead, Agustin Redonda, Christian von Haldenwang, Giovanni Occhiali, Giulia Mascagni and Harshil Parekh | 21 April 2026Fiscal, Blog | Tags: Domestic Revenue Mobilization, GTED, Tax Expenditures
With aid budgets shrinking and debt vulnerabilities mounting, the $4 trillion governments forgo annually through exemptions, credits, and preferential rates demands greater transparency and accountability.... continue reading

Governing Tax Expenditures: Lessons from Four Advanced and Emerging Market Economies
Sofia Berg, Sanjeev Gupta and Agustin Redonda | 2 March 2026Fiscal, Blog | Tags: Brazil, Domestic Revenue Mobilization, France, India, Tax Expenditures, United Kingdom
This blog builds on four Tax Expenditures Country Reports published within the series hosted by CEP and IDOS, and shows how Brazil, France, India, and the United Kingdom govern tax... continue reading

Tax Expenditures in Sub-Saharan Africa: An Expensive Practice?
Li Liu, Todd Schneider, Can Sever and Irena Jankulov Suljagic | 27 November 2025Fiscal, Blog | Tags: Domestic Revenue Mobilization, Sub-Saharan Africa, Tax Expenditures
Tax expenditures are less well understood in Sub-Saharan Africa than in other regions, and deserve closer attention given the region’s macro-fiscal challenges. A new IMF paper sheds some additional light on TEs in SSA, their potential importance to domestic revenue mobilization, and offers a roadmap for reform. ... continue reading

A Renewed Urgency to Rationalize Tax Expenditures in Low- and Low-Middle Income Countries
Sanjeev Gupta and Agustin Redonda | 16 April 2025Fiscal, Blog | Tags: Domestic Revenue Mobilization, Tax Expenditures, Tax Reform
In this blog, we argue that the case for streamlining and reforming TEs has become even more urgent. This urgency arises from recent developments including the decisions by the United... continue reading

Beyond the Budget: A Global Perspective on Social Spending Through Tax Expenditures
Flurim Aliu and Agustin Redonda | 20 November 2024Fiscal, Research Papers | Tags: Inequality, Social Protection, Tax Expenditures, VAT
This study underlines the necessity for meticulous evaluation and efficient design of TEs to better align TE regimes with governments' social policy objectives as well as to minimise unintended social... continue reading