Are Tax Expenditures a Good Way to Redistribute?
Silvia Avram | 1 July 2016
Fiscal, Blog | Tags: Inequality, Tax Expenditures, Taxes
Since 2007, governments across several European countries have implemented cuts to their social programs in an attempt to tackle the fiscal deficits generated by the last economic and financial crisis. At the same time, they have increasingly made use of various tax related measures to achieve implicit or explicit redistributive purposes. For example, the UK government has implemented some of the most drastic welfare cuts while almost doubling the amount of income exempt from personal income tax. Similarly, France recently increased its zero rate tax band, Italy launched a new refundable tax credit for employees, and Germany increased significantly a number of its existing tax reliefs[i]. In 2015, at least eight other countries have taken measures to decrease their tax base which can be thought of as partly having a social purpose.
It may be that redistribution through the tax system can have several advantages such as decreased administrative costs, lower stigma and application costs or/and increased political acceptability. However, are tax expenditures well placed to channel resources towards the poor? The current consensus is that tax expenditures are a large fiscal item that is subject to much less scrutiny than comparable spending programs[ii]. There is also evidence showing that many tax exemptions and deductions aimed at incentivising behaviours (such as for example, tax deductions for expenditure on energy saving and insulation) tend to benefit upper and middle income groups rather than the poor[iii]. Less is known about the way tax expenditures that have a clear social goal affect the income distribution.
In a paper[iv] examining tax expenditures in six European countries[v] in 2010, I used microsimulation techniques combined with household micro-data to investigate the prevalence and distributional effects of legal provisions that lower taxable income (tax allowances) or the final tax liability (tax credits) for specific groups of personal income tax payers. I showed that both tax allowances and tax credits were pervasive in the countries that used them, reaching large sections of the populations not just the well-off. However, with the exception of Denmark, those in the bottom 20% of the income distribution were much less likely to receive these tax advantages compared to the rest of the population. Furthermore, the value of these tax advantages tended to rise with income meaning that their effect was generally to increase inequality.
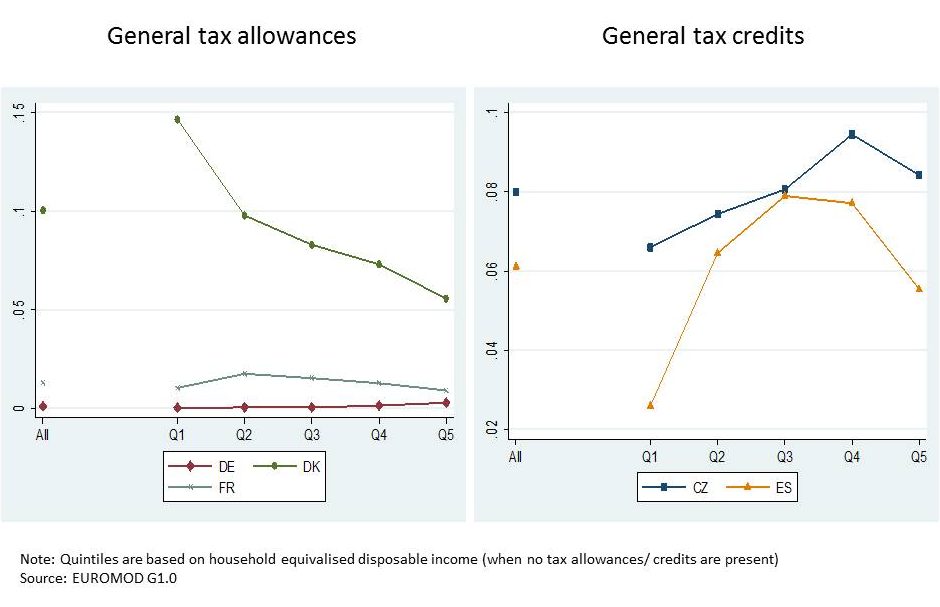
Even measures that might have been expected to help low income individuals and families such as general measures (that are meant to benefit all tax payers), or income related measures (that are explicitly tied to –low- taxable income) did not necessarily have the anticipated impact. For example, while general tax allowances were progressive in Denmark and to a lesser extent in France, they were strongly regressive in Germany. General tax credits were similarly skewed towards the middle and higher income groups[vi] (Figure 1)[vii].
Fig1: Average general tax allowances and tax credits, as a proportion of household disposable income, by income quintile
Income related allowances and credits (where eligibility is limited to taxpayers below certain income thresholds) are by design targeted towards low income groups. As such, they may be expected to be clearly more beneficial to the poor rather than the better-off. However, even in this case, only three out of seven measures included in the analysis were unambiguously progressive (Figure 2)[viii], meaning they helped lower-income groups more compared to the rest of the population.
Fig 2: Average income related tax allowances and tax credits, as a proportion of household disposable income, by income quintile

Together, these findings suggest that the distributional effects of tax allowances and tax credits are complex and often unanticipated. The reasons behind these patterns are not straightforward but they have to do with the intricate ways tax expenditures operate and the fact that their ultimate impact on household disposable incomes depends on an array of other factors. For example, strong progressivity in the personal income tax rate schedule means that general deductions (allowances) are more valuable to higher income tax payers, despite often being portrayed as a means to boost the incomes of the low-paid. Likewise, taxable income may not always be a good measure of household financial resources. As a result of their complexity, tax expenditures are not well suited to redistribute resources to families and individuals on low incomes even when explicitly designed to do so. Policy makers have less control over who benefits and how much they gain from tax expenditure measures compared to traditional spending programs. There is only one exception to this overall pattern, namely refundable (or non-wastable) tax credits. Because their amount is fixed irrespective of the taxpayer’s taxable income or initial tax liability, low-income and poor households can usually benefit in full from these measures. They are thus generally pro-poor. But the characteristics of refundable tax credits and the way they operate also make them very similar to traditional benefits.
Tax expenditures may appear to be an attractive alternative to social spending programs, especially in the context of a political backlash against traditional welfare. However, policy makers should keep in mind that they operate in complicated and opaque ways and control over their beneficiaries is limited .With the exception of refundable tax credits, it appears very difficult to design tax expenditure measures that are able to reach and benefit the poor.
[i] European Comission, Tax trends in the European Union, http://ec.europa.eu/taxation_customs/taxation/gen_info/economic_analysis/tax_structures/index_en.htm
[ii] Greve, B., 1994. The hidden welfare state, tax expenditure and social policy. Scandinavian Journal of Social Welfare, 3(4), 203-211, OECD, 2010. Tax Expenditure in OECD Countries, OECD, Paris. Also, see http://www.cepweb.org/tax-expenditures-and-sustainability.
[iii] Burman, L.E., Geissler, C., Toder, E.J., 2008. How Big Are Individual Tax Expenditures, and Who Benefits from Them? American Economic Review: Papers & Proceedings, 98(2), 79-83, Toder, E.J., Harris, B.H., Lim, K., 2009. Distributional Effects of Tax Expenditures, Tax Policy Center.
[iv] Avram, S., 2014. The distributional effects of personal income tax expenditure, ISER.
[v] The six countries are the Czech Republic, Denmark, Germany, France, Spain and Italy.
[vi] Note that only countries where general instruments exist (and can be modelled by EUROMOD) are represented in the graph.
[vii] The X axis represents disposable income split into five groups; each group represents 20% of the income distribution (for example-Q1 stands for the poorest 20% of individuals).
[viii] Note that only countries where income related instruments exist (and can be modelled by EUROMOD) are represented in the graph.